Introducing Candlestick v1.0
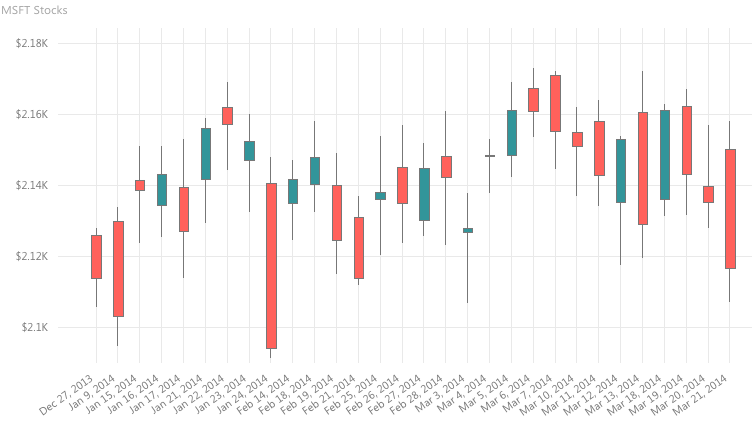
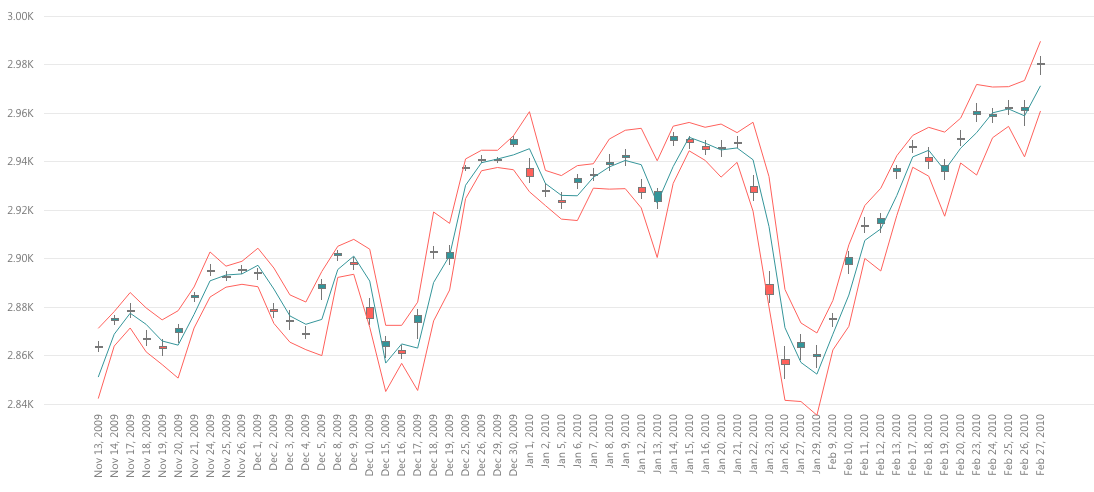
Candlestick by OKViz is a custom visual designed to present stock data, using a very specialized chart made of several candles.
[UPDATE 28-03-2017]
You can see the updated changes here: Candlestick Change Log
You can see the updated changes here: Candlestick Change Log
In the last update, we made some interesting changes:
- We migrate all the code to the new Visuals API 1.3.
- We fixed some bugs in the placement of the labels in the axis.
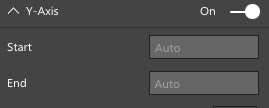
- We changed the Y-Axis range: now, if you leave the Start and the End options to “Auto”, the visual determine the best value to start, based on the data points value. Like the standard Line Chart.
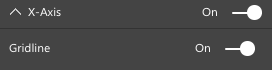
- We added the option to show a gridline.
- We added a few additional customization options.
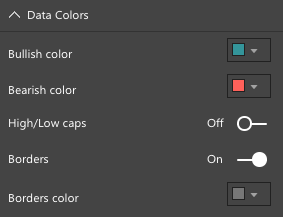
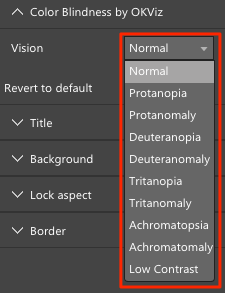
- We implemented the Color Blindness by OKViz library. Now you can figure out how people affected by color vision diseases will see the colors of your candles. Read more about it at http://okviz.com/blog/color-blindness.
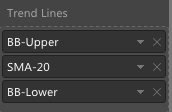
- We added a new Trend Lines field, to bind with multiple measure. It is useful to set some analysis tools such as Bollinger Bands.
Candlestick by OKViz is FREE for all, you just have download it from http://okviz.com/candlestick.
If you have any idea to improve the visual, please leave a feedback in the comments below.