Power BI for Tableau Developers: Tables
In this third installment of Power BI for Tableau Developers, we are going to be covering a topic that might seem simple at first glance, but I hope you’ll come to appreciate… Tables. For those familiar with Power BI, I am not referring to the Table chart element, I specifically am addressing the Matrix chart. This chart has become a personal favorite of mine because of the flexibility and ease of use for stakeholders.
What is a Matrix
A Matrix is a report visual available in Power BI that is essentially a table with a lot more customization options and features than a normal table. If you are familiar with PivotTables in Excel, you will certainly recognize many commonalities between the two. A Matrix enables you to use the Rows, Columns, and Values that are displayed within your table. Although this seems like a fairly simple feature, many Tableau users see this and go, WOW, this is such a simpler way to build a table than what we’re used to!
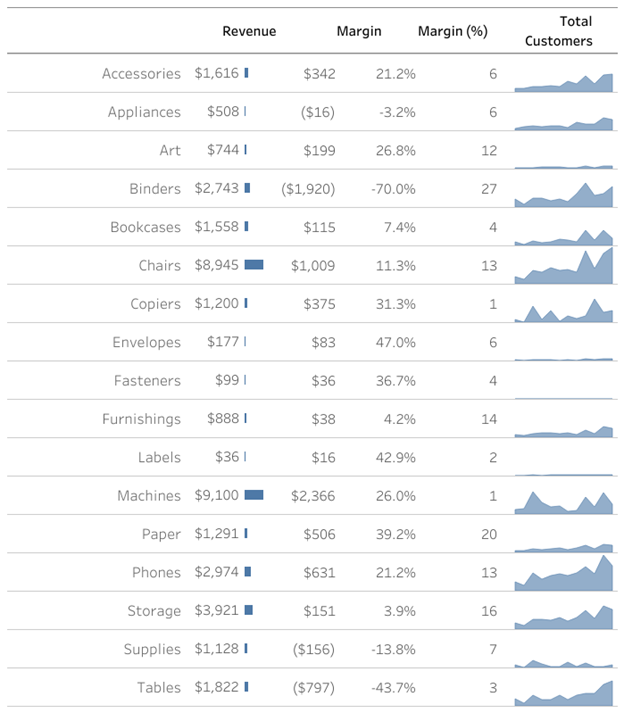
This is a table in Tableau.
This is a matrix in Power BI.
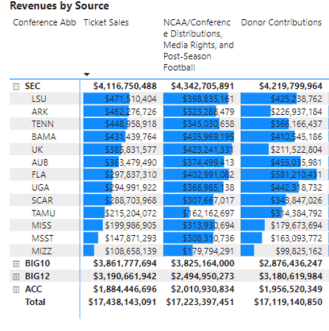
Two very common use cases with matrices are drop downs and drill through. In a matrix, a drop-down field is automatically enabled when you create a hierarchy within the Rows field. So essentially, when you drag numerous fields to the Rows area, these sub-groups break out automatically upon user click to expand the previous field. For those using Tableau, you know that nothing comes that easy in Tableau and for tables especially, this functionality can be tricky.
The second feature that is useful in matrices is drill throughs. By enabling a drill through on a field in your matrix, you enable (an)other layer(s) of exploration in your data. If you add the field that you want to drill through on to the destination chart, you will then be able to right-click on the base tab and select Drill through, and then choose the tab that you want to navigate to. This action will automatically filter your destination for this value. While tables are very descriptive in nature, being able to drill through with matrices does enable a level of investigative capability that is extremely useful for end-users.
Creating a Matrix in Power BI
In this example, we will use my favorite NCAA financial data set that shows the revenues and expenses for all public NCAA universities from 2005 to 2017. In this example, I created a matrix that shows the source of conference and team revenues by source filterable by year. I have placed the different revenue fields as values and then layered Conference and Team in the Rows. This enables users to expand the conference if necessary and drill through on those values as well.

The structure of our data is such that each column is a different measure as the data set contains a column for each category of revenue/expense rather than a row. Because of this, the table that I’ve built as an example has no fields in the column area. The plus side is that you get to control the calculation of each measure at a very specific level. The downside is that you cannot enable column totals.
As you can see in the table below, the drop-down functionality that is native to this chart is extremely useful for users. You can create multiple levels of drop-down that enable a lot of cool custom insights. Next, I am going to show you how to replicate this functionality in Tableau and help you understand how difficult some of this native functionality is to achieve.
Recreating Power BI Matrix in Tableau
There are two main ways of creating tables in Tableau:
- Using Measure Names and Measure Values as the rows and the columns in your table;
- Creating columns by using a measure field named MIN(0.0). This allows you to create a custom amount of columns where you can edit and format this column separate from the rest.
When using Measure Names/Measure Values those fields are generally formatted together because you generally are either formatting the Measure Name or the Measure Value field.
See an example of using Measure Names and Measure Values below.
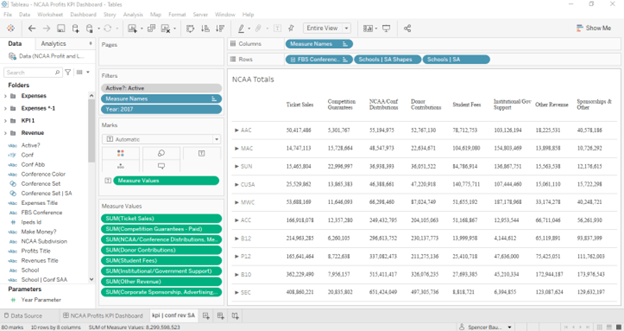
As you can see in the example above, getting the basic table layout is fairly straightforward. Adding in the drop-down features is where things get fairly complicated. In order to do this, we need to create a custom field that changes its display based upon whether the Conference is IN or OUT of a Set. We can change what values are in this Set when clicking on a Conference. Lastly, set up a Set Action to enable dashboard interactivity.
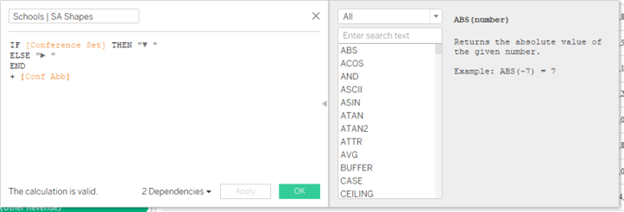
You find an example of the functionality below.
Conditional Formatting
Now that you’ve seen how to create basic tables/matrices, a natural progression is to add some conditional formatting. It shouldn’t come as a surprise, but adding conditional formatting in Power BI is very easy and straightforward!
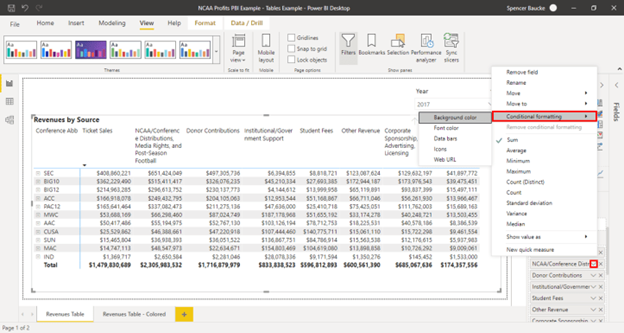
To add conditional formatting, click on the drop-down arrow for the field in your visual that you want the formatting applied to. In the pop-up menu, select Conditional formatting and then choose what type of formatting you would like. You are able to choose from a variety of options but in this example we choose Background color.
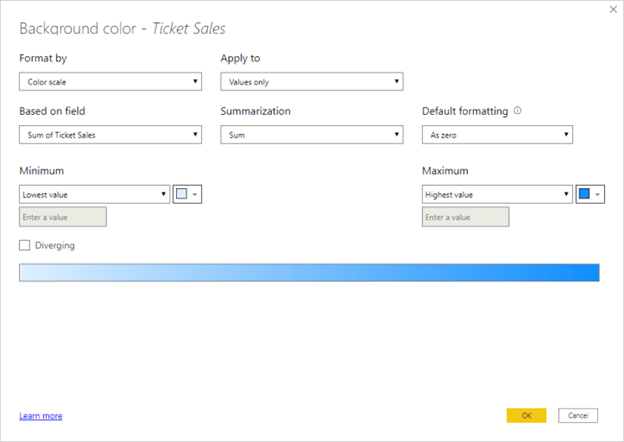
Within the Background color formatting, there are several options on what you want formatted and how you want it to be formatted. In this example, we are going to format the Ticket Sales field using a gradient color scale showing the highest amounts with a dark blue. We are going to apply this just to the values and not to the totals. See the setting below.
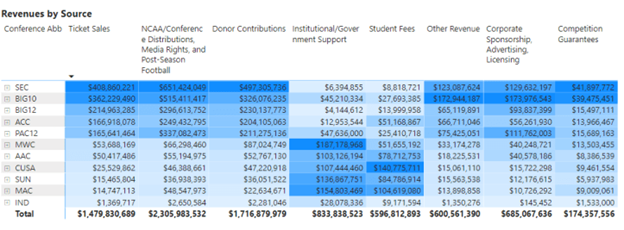
See the final result of the conditional formatting below.
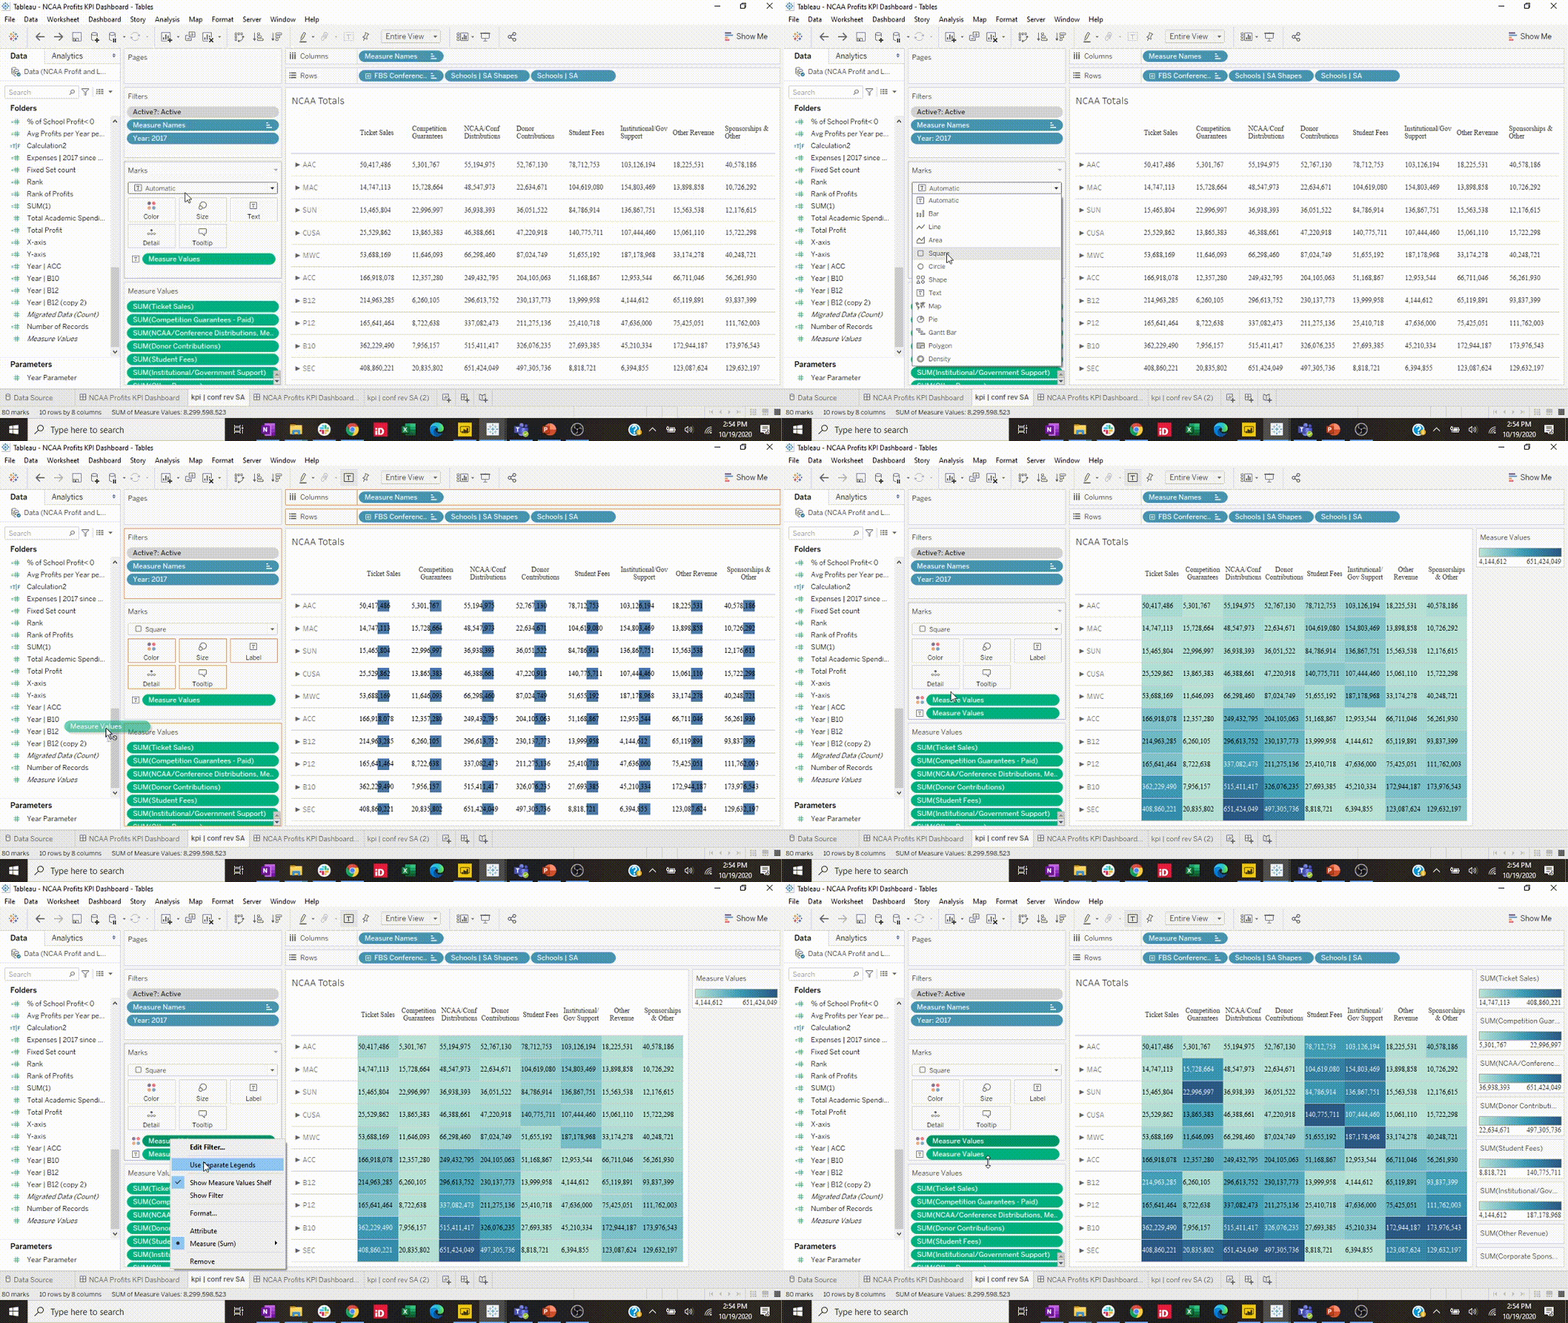
Now, let’s create the same formatted table in Tableau! Since we are using Measure Names and Measure Value in this table the formatting that we do in the Marks card will affect all of the columns in the table. Choose the drop-down in the Marks card and select the Square option. Now drag Measure Values to the Color mark. This will have all of the metrics being colored on the same scale; but if you want to color each metric on a separate scale as we did in the Power BI example, right-click on the Measure Value field that was dragged to Color and select Use Separate Legends.
Comparison
As you can see, creating a Matrix equivalent in Tableau is much harder than one might expect. I chose to write on this particular topic because it highlights a difference in development time between Tableau and Power BI. All of the functionality you can find in a Matrix is native, no extra hacks or workarounds required. The straightforward design of a table-like visual with the drop-down and drill-through capabilities of a Matrix is very useful when building out reports for users that are very used to tables such as Finance or Accounting.
To be fair to Tableau, if you are an experienced developer and have the time to create such a complex table, the level of customization is greater than that available in Power BI. As is the case most of the time with Tableau, whatever you can think of, you can create. The question then becomes, are you skilled enough to create the visual and how much time do you want to devote to creating it?
To sum it up, creating table views like the Matrix in Power BI is easily within the reach of beginner Power BI developers. To recreate a similar view in Tableau one must be familiar with Set Actions, sorting by hidden fields in your table, and have a skill set that is rather experienced. This highlights how the ease of creating visuals in Power BI can be an advantage for the average user.